Low Carb vs. High Carb - My Surprising 24-day Diabetes Diet Battle
By Adam Brown
 By Adam Brown
Twitter summary: What I learned from doubling my carb intake: the same average blood sugar, but four times as much hypoglycemia, more work, stress, & danger.
As a teenager, I ate a high carb diet that included lots of Goldfish crackers, white sandwich bread, pasta, and white potatoes. It was tasty, but it put my blood sugars on a wild roller coaster every single day. Things turned around in college when I learned about nutrition, got on CGM, and spent time with health conscious friends. I soon realized that eating less than 30 grams of carbs at one time was a complete gamechanger. I’ve stuck with that approach ever since.
But is this lower carb method actually better for my blood sugars, or have I just been fooling myself? To find out, I took on a somewhat terrifying self-tracking experiment:
-
12 days of my usual, lower-carb diet, which averaged 146 grams of carbs per day (21% of daily calories). My carbs were primarily from nuts, seeds, vegetables, and a bit of fruit.
-
12 days of a higher-carb, high whole-grain diet, which averaged 313 grams of carbs per day (43% of my daily calories). My sources of carbs were NOT junk food: plain oatmeal, whole wheat bread, quinoa, wild rice, and fruit.
Neither of these was unrealistic. My lower-carb diet was nowhere near Atkins level (20 grams per day), and the higher-carb diet was consistent with the “average” 45% carb diet in people with diabetes (according to ADA).
Even though this was a one-person (n=1) experiment, I wanted to be as scientific and fair as possible: eating whole, unprocessed foods in both periods; counting and tracking every single gram of carbohydrate (LoseIt! app); wearing CGM 24/7 and downloading the glucose data to document what happened (Dexcom G5 and Clarity); taking insulin before meals (5-15 minutes prior) and correcting when blood sugars went out of range; and keeping total calories and my high level of activity as consistent as possible (Fitbit).
Before starting, I assumed:
-
Low-carb eating = lower average blood sugar, much more hypoglycemia.
-
High-carb eating = higher average blood sugar, less hypoglycemia, way more fun.
How wrong I was!
To my utter surprise, both diets resulted in the same average glucose and estimated A1c. But there were major tradeoffs:
-
The higher-carb, whole-grain diet caused four times as much hypoglycemia, an extra 72 minutes per day spent high, and required 34% more insulin. (A less healthy high-carb diet would have been far worse.)
-
Doubling my daily carbs also added much more effort and produced far more feelings of exhaustion and diabetes failure. It was not fun at all, and the added roller coaster, or glycemic variation, from all the extra carbs made it more dangerous.
I would summarize it like this: high-carb eating felt like highway driving from Los Angeles to San Francisco, alternating between 120 mph and 10 mph. Low-carb eating felt more like driving between 55 and 75 mph. The final averages were the same (65 mph), but the experience was far different in terms of safety and effort.
This article details the results from this experiment, starting with the glucose and insulin data. The key part is the Lessons Learned section, where I’ve distilled my eight biggest takeaways. In the appendix are photos of the meals I ate and activity data. A follow-up article posted here answers reader questions sent via email or on Twitter. And if you find this article useful, check out my upcoming book, Bright Spots & Landmines!
This is far from a perfect experiment, and I recognize it has many limitations. The goal was to change my diet, to honestly document what happened (with real data from my devices), and to share what I learned. A lower-carb approach requires some tradeoffs (convenience, variety, time) that may not be worth it for everyone. But I hope this article sheds light on why lower carb seems to work for my diabetes, and more broadly, why we must move beyond A1c alone in describing glucose control.
[Editor’s Note: You should absolutely talk to your healthcare provider before making any changes to your own diet, medications, or routine.]
Results
Glucose Profiles
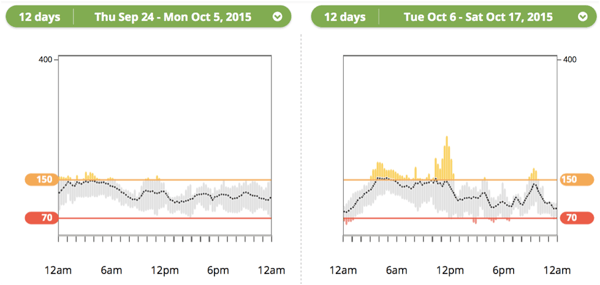
The plots below show my daily glucose profiles averaged over 12 days of high-carb and 12 days of low-carb eating. The black line shows the average at that time point, while the colored bars indicate the range of values at that time (yellow=high, gray = in range, red = low).
Can you guess which is high carb and which is low carb?
|
Observations: Low Carb - Very consistent average throughout the day with no major spikes (black line). - The bars are short and almost completely gray, meaning the vast majority of glucose values fell in the tight zone of 70-150 mg/dl. - No obvious periods of serious highs or lows, consistent with my glucose data in the months prior to this experiment. |
Observations: High Carb - The black average line is more spikey, indicating more variability - The bars at most time points are longer (wider range of values at one time), and there are more highs (yellow bars) and a few more lows (red bars). - Trouble in early morning (highs), after breakfast (highs), late afternoon (lows), after dinner (highs), midnight (lows), and 1 AM-5 AM (steadily rising glucose). |
Average Glucose, A1c, Time-in-Range
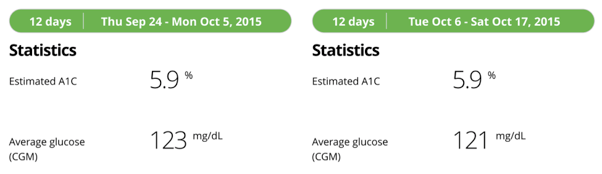
The different profiles above resulted in a near-identical average glucose and the same estimated A1c (low carb on left):
How is this possible? Averages can be misleading! Here are the time-in-range results, where things start to get interesting (low-carb on left):
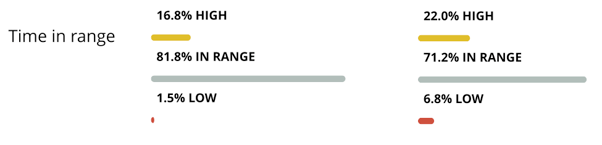
To achieve the same average blood sugar on the high-carb diet, I experienced more than four times as much hypoglycemia (less than 70 mg/dl): 97 minutes vs. 22 minutes per day. I also had 72 extra minutes per day above 160 mg/dl during the high-carb period. Those trends mostly cancelled out, resulting in a similar average but far different blood sugar profiles.
Insulin
I needed 34% more insulin on the high-carb diet, as my bolus insulin doubled to cover the additional carbs. I did not change my daily basal insulin (22 units) between the periods.
|
|
Low Carb |
High Carb |
|
Total Daily Dose |
34 units |
45 units |
|
Bolus |
12 units |
23 units |
Lessons Learned
1. Average glucose and estimated A1c did not capture the vast difference in variability or hypoglycemia between the two phases. Look at the two plots below – the one on the left is from a low-carb day, while the one on the right was from a high-carb day. I chose these two days because they had near-identical average glucose levels: 123 mg/dl (low carb) vs. 121 mg/dl (high carb). But the diabetes experience of those days was FAR different.
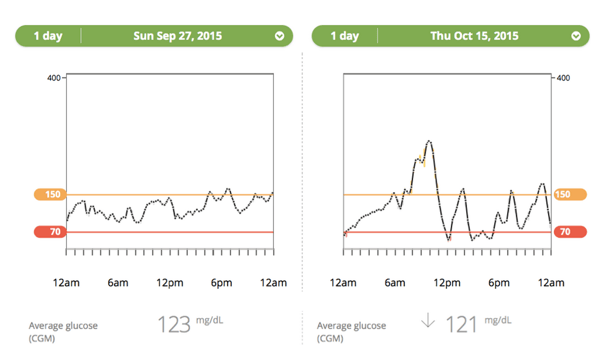
Every day of high-carb eating also brought the dreaded double arrow trend on my CGM: glucose rising or falling at more than 3 mg/dl per minute. For example, a -100 mg/dl blood sugar change in 25 minutes. Those scary drops were like riding a roller coaster day after day. By contrast, low carb eating rarely resulted in more than a 1 mg/dl per minute change (-25 mg/dl in 25 minutes).
2. I experienced four times as much hypoglycemia on the high-carb diet. In my effort to treat highs, I had to accept more lows. This tradeoff between high and low blood sugars is what made high-carb eating a tightrope walk every day. I could have been less aggressive, but that would have caused longer and larger spikes in glucose. Low-carb eating made it easier to spend more time-in-range because there were fewer spikes and drops to deal with – instead of a tightrope, it was more of an open sidewalk.
3. Insulin is a dangerous drug, and doubling my carbs required 34% more every day. Large-carb meals also required two to five times more insulin in a single dose. My typical lower-carb meals needed one or two units at a time to cover vegetables, nuts, protein, and a bit of fruit – all raise glucose in small increments (+20 to +60 mg/dl) over a couple hours. By contrast, higher carb meals – even whole grains – often required five- and eight-unit boluses. Insulin has been called the second most dangerous drug (after the blood thinner warfarin), and insulin errors cause more than 97,000 hypoglycemia hospitalizations each year. I see value in taking smaller doses.
4. Feelings of stress and failure skyrocketed on the higher-carb diet. All the extra work and planning was exhausting! While a lower-carb diet generally lets me put diabetes in the background, a higher carb diet requires constant vigilance, measuring, worrying, reacting to CGM alarms, and pre-planning. My twelve days of large-carb meals were tiring and mentally taxing – I felt like I was getting it wrong all the time. Here are some of the differences in effort:
|
Low Carb Experience |
High Carb Experience |
|
Little carb counting. Flat one- or two-unit boluses for most meals and snacks |
Constant carb counting, measuring and entering into bolus calculator. Highly variable amounts of insulin. |
|
Take insulin at meal start, after, or not at all. |
Critical to take insulin before meals |
|
Easier to track boluses – one or two unit boluses stop lowering blood glucose in ~2 hours |
Harder to track boluses – large doses (5+ units) can still be lowering glucose at 4+ hours |
|
Smaller activity impact: boluses are small and not significantly accelerated from any type of exercise. Stable blood sugar makes activity easier. |
Larger activity impact: big boluses are dramatically accelerated from light activities like walking. Variable blood sugar makes activity more challenging. |
5. Higher-carb eating put more pressure on accurate and precise estimates (meal size, needed insulin, impact of activity), and penalized me harder for getting it wrong. As a hypothetical: if I’m about to take 10 units of insulin, but my estimate is 30% too high (the meal is actually 70 grams of carbs, not 100 grams), that’s a three-unit overdose. For me, that translates to a massive 105 mg/dl difference in blood sugar: 100 vs. 205 mg/dl, or even more dangerous, 45 vs. 150 mg/dl. Compare that to a meal with 20 g of carbs requiring two units of insulin – a 20% error = 0.4 units, or just a 14 mg/dl difference (glucose meter errors alone can be larger than that!). A lower-carb diet put much less pressure on having accurate estimates. I’m a big fan of reducing diabetes math!
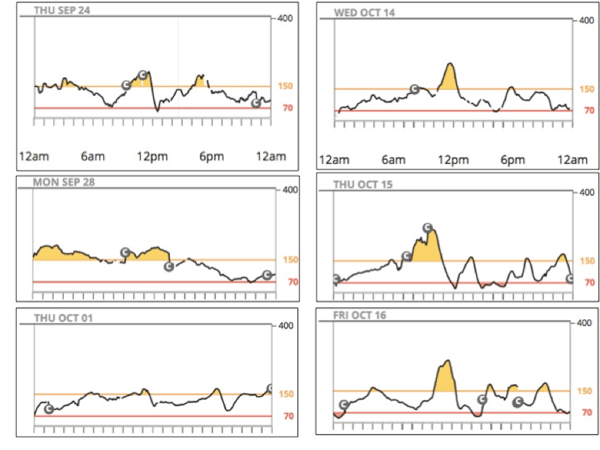
6. High-carb meals were most challenging at breakfast. Look at the pictures below showing my three worst morning (7 am to noon) blood sugar curves for the 12 days of low carb (left) vs. 12 days of high carb (right). Low-carb meals were not perfect, but the post-breakfast highs were so much faster, higher, and longer after high-carb meals. As anyone with diabetes knows, breakfast makes a huge difference for getting a day of blood sugars started off right.
Low Carb vs. High Carb – Worst Mornings
7. It was a harder to remember to eat vegetables on the higher-carb diet. When meals contained 60 grams of carbs or more, it was easy to just eat a sandwich and a piece of fruit, or chicken and a side of rice – those meals felt “complete” as I was making them. On the low-carb diet, vegetables automatically filled the side-dish spot, and the meal didn’t feel “complete” unless some veggies were on the plate (a single piece of chicken is just not enough food!). My higher carb meals were less likely to include vegetables, since the reminder to include them was not as apparent.
8. Eating a higher-carb diet without checking glucose often or wearing CGM would be like driving a racecar at 150 mph blindfolded. For all the reasons listed above, checking blood glucose often (6+ times per day) or wearing CGM seems essential on a higher-carb diet – it allows for corrections after the inevitable turbulence of post-meal glucose spikes, large insulin doses, incorrect estimates, and hypoglycemia. I’m fortunate to have access to CGM, and I recognize this is not possible for everybody with diabetes. But for those who choose to eat high carb, checking glucose often is critical.
Concluding Thoughts
I’m leaving this experiment with an even better understanding of why lower-carb eating works for me. And as I’ve discussed in previous columns (and show below) there is still great variety and taste to be found in a lower-carb diet.
I do not believe there is a single diet for all people with diabetes – we all come from different circumstances, and what works for me may not be worth it for many others. I just know that my blood sugars were completely out of control as a teenager, and they are much more in control now. The biggest factor in that change was eating fewer carbs at each meal.
What works for you?
[Editor’s Note: This article should not be interpreted as medical advice. Please consult with your healthcare provider before experimenting with changes to your diet, insulin, or medication regimen.]
Questions?
A follow-up piece answers the questions and comments I received following publication. You can send others along here or on Twitter.
Appendix 1: Meal Pictures and Calorie Information
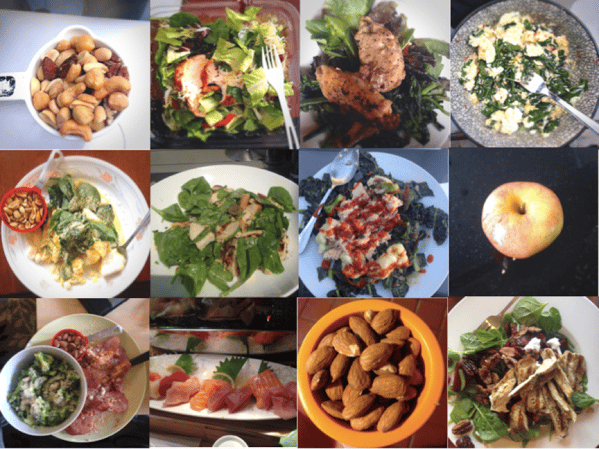
Low Carb Meals
Here are some pictures of the typical low-carb meals I ate during this experiment. I’ve described my low-carb diet in depth in a previous column. It’s a lot of nuts and seeds, vegetables, chicken, fish, and eggs. I do eat some fruit (mostly berries and apples), but not every day.
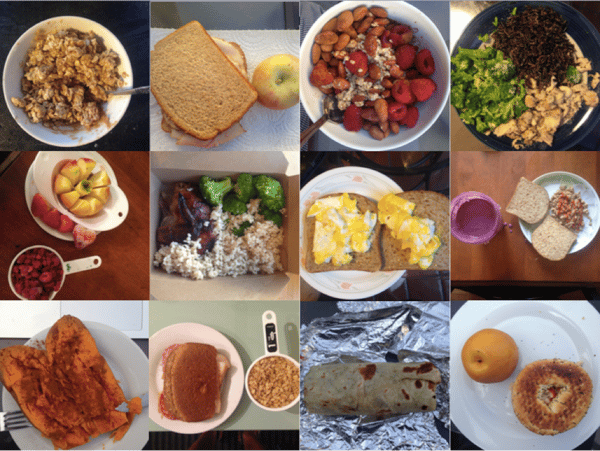
High Carb Meals
My high carb meals relied on whole foods: old fashioned plain oatmeal; whole wheat bread or bagels or tortillas; fruit (apples, pears, berries); brown and wild rice; quinoa; sweet potatoes; etc. I wanted to isolate the impact of higher carb intake, so keeping the food healthy was essential – adding junk food would have confounded the experiment. The one disaster “healthy” food I tried was granola – yikes does that spike blood sugar quickly.
Calorie Information
I averaged very similar calorie intake during the two periods – 2,727 calories on low carb vs. 2,872 calories on high carb. It wasn’t identical – this wasn’t a lab setting! – but it was extremely close given the length of this experiment, the real-world eating I was doing (including meals out), and my level of activity. The extra hypoglycemia on the high carb diet could easily explain my very slightly higher-calorie intake during those 12 days.
A Note on Insulin Changes
For comparison, I deliberately kept my basal insulin and food bolus settings consistent between the two phases. Educator Jen Block pointed out that my insulin settings might be optimized to cover the lower-carb meals I usually eat (higher in fat and protein). Over a longer period of time, I could have changed my insulin settings to fine-tune them for the higher-carb diet. It’s hard to know how much that would have improved the glucose results.
There’s also an experience component here – the higher-carb diet added meals I have less experience taking insulin for. Even though I was counting the carbs accurately (reading the nutrition labels and using LoseIt!), there is no substitute for experience. It’s possible that if I kept at the high carb diet for long enough, I would have improved.
On half the nights during the low-carb phase, I wore overnight closed-loop from midnight to 7am (an extension of a study we previously wrote about). There are four reasons why I don’t think it had a major influence on the results: (i) the real difference between high carb and low carb appeared during the day, where the two phases were directly comparable on basal insulin; (ii) the closed-loop system used my pre-programmed basal rates as a guide, and those did not change between the two phases; (iii) my average 7am blood sugar was nearly identical between low carb and high carb phases (132 mg/dl vs. 137 mg/dl); (iv) the range of blood sugars at 7am was very similar between low carb and high carb (97-152 mg/dl vs. 108-161 mg/dl).
Appendix 2: Activity
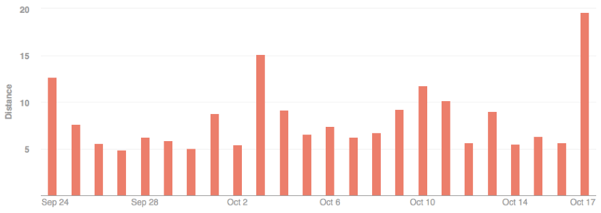
As measured by my Fitbit, I averaged 16,653 steps per day on the low-carb diet vs. 18,505 steps on the high-carb diet. For some, that seems like a large difference in average activity, but it really isn’t – 1,852 steps per day is the equivalent of a 15-minute walk (0.8 miles), shorter than my daily commute to work. And as you can see from the chart below (showing daily distance walked for the 24-day period), the average is roughly similar with a few outlier days. I had one very active day on October 17 (long bike ride), which accounted for half of the total activity difference between the two periods. It would have been ideal to have identical steps in both 12-day stretches, but the tradeoff would have been a less real-world experiment.
Both 12-day periods were more active than my average 14,929 steps per day this year. A possible explanation is travel – I barely had any during the 24-day experiment (by intention), which allowed me to be more active than in a typical 24-day stretch with more travel.
[Tremendous thanks to Dr. Henry Anhalt, Ms. Jen Block, Dr. Zachary Bloomgarden, Mr. Lane Desborough, Jim Hirsch, Dr. Philip Home, Dr. Nate Heintzman, Ms. Davida Kruger, Ms. Virginia Valentine, and Ms. Hope Warshaw for critically reviewing this piece. They made the content so much better!]